 Catalogue PIGMA
marine ecosystem
Type of resources
Available actions
Topics
Keywords
Contact for the resource
Provided by
Years
Formats
Representation types
Update frequencies
Scale
Resolution
-
This dataset presents the resulting assessment grid (based on the EEA reference grid) with the classification of ecosystem health of the transitional, coastal and marine waters in the context of the Water Framework Directive (WFD) and the Marine Strategy Framework Directive (MSFD). This classification has been performed using the MESH+ (Marine EcoSystem Health) tool. The MESH+ tool builds on the EEA assessment tools developed and applied in the context of assessing the degree of contamination (CHASE+), eutrophication (HEAT+) and biodiversity (BEAT+) in Europe's seas (EEA, 2018a, 2019c; Vaughan et al., 2019). MESH+ makes use of the same data sets and threshold values used in these assessments but recombines these in a new framework that addresses 'ecosystem condition'. The overall area of interest used is based on the marine regions and subregions under the MSFD. Additionally, Norwegian (Barents Sea and Norwegian Sea) and Icelandic waters (’Iceland Sea’) have been added (see Surrounding seas of Europe). Note that within the North East Atlantic region only the subregions within EEZ boundaries (~200 nm) have been included. The spatial resolution of the assessment grid is 20 km x 20 km in coastal areas and 100 km x 100 km in offshore areas. This dataset underpins the findings and cartographic representations published in the report "Marine Messages II" (EEA, 2020): https://www.eea.europa.eu/publications/marine-messages-2
-
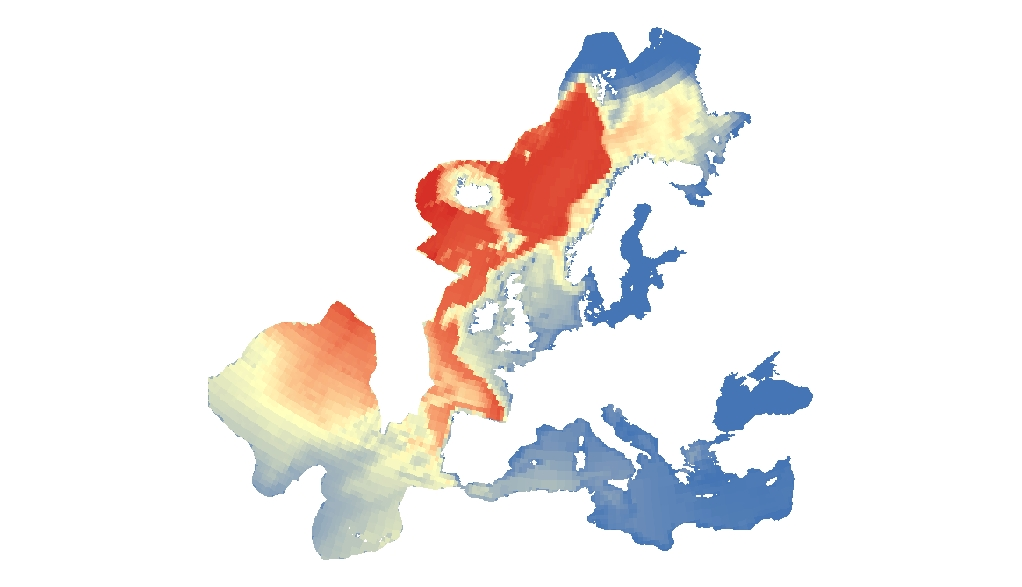
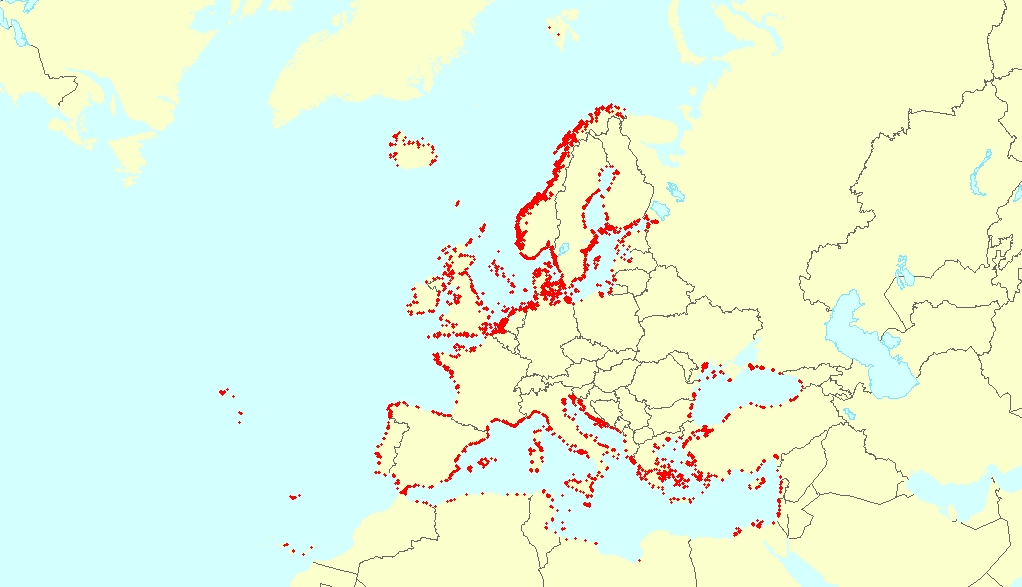
This raster dataset represents the probability of occurrence of whales in the Europe Seas, where the species included are: Blue whale, Sei whale, Humpback whale, Sperm whale, Fin whale and Northern right whale. The northern right whale model only describes the range of the western population of this species, since the eastern population is probably almost extinct. Thus, the northern right whale model only partly overlaps with the EEA area on interest. This dataset is based on AquaMaps distribution maps (version 10/2019). The dataset has been prepared in the context of the development of the first European Maritime Transport Environmental Report (EMSA-EEA report, 2021: https://www.eea.europa.eu/publications/maritime-transport).
-
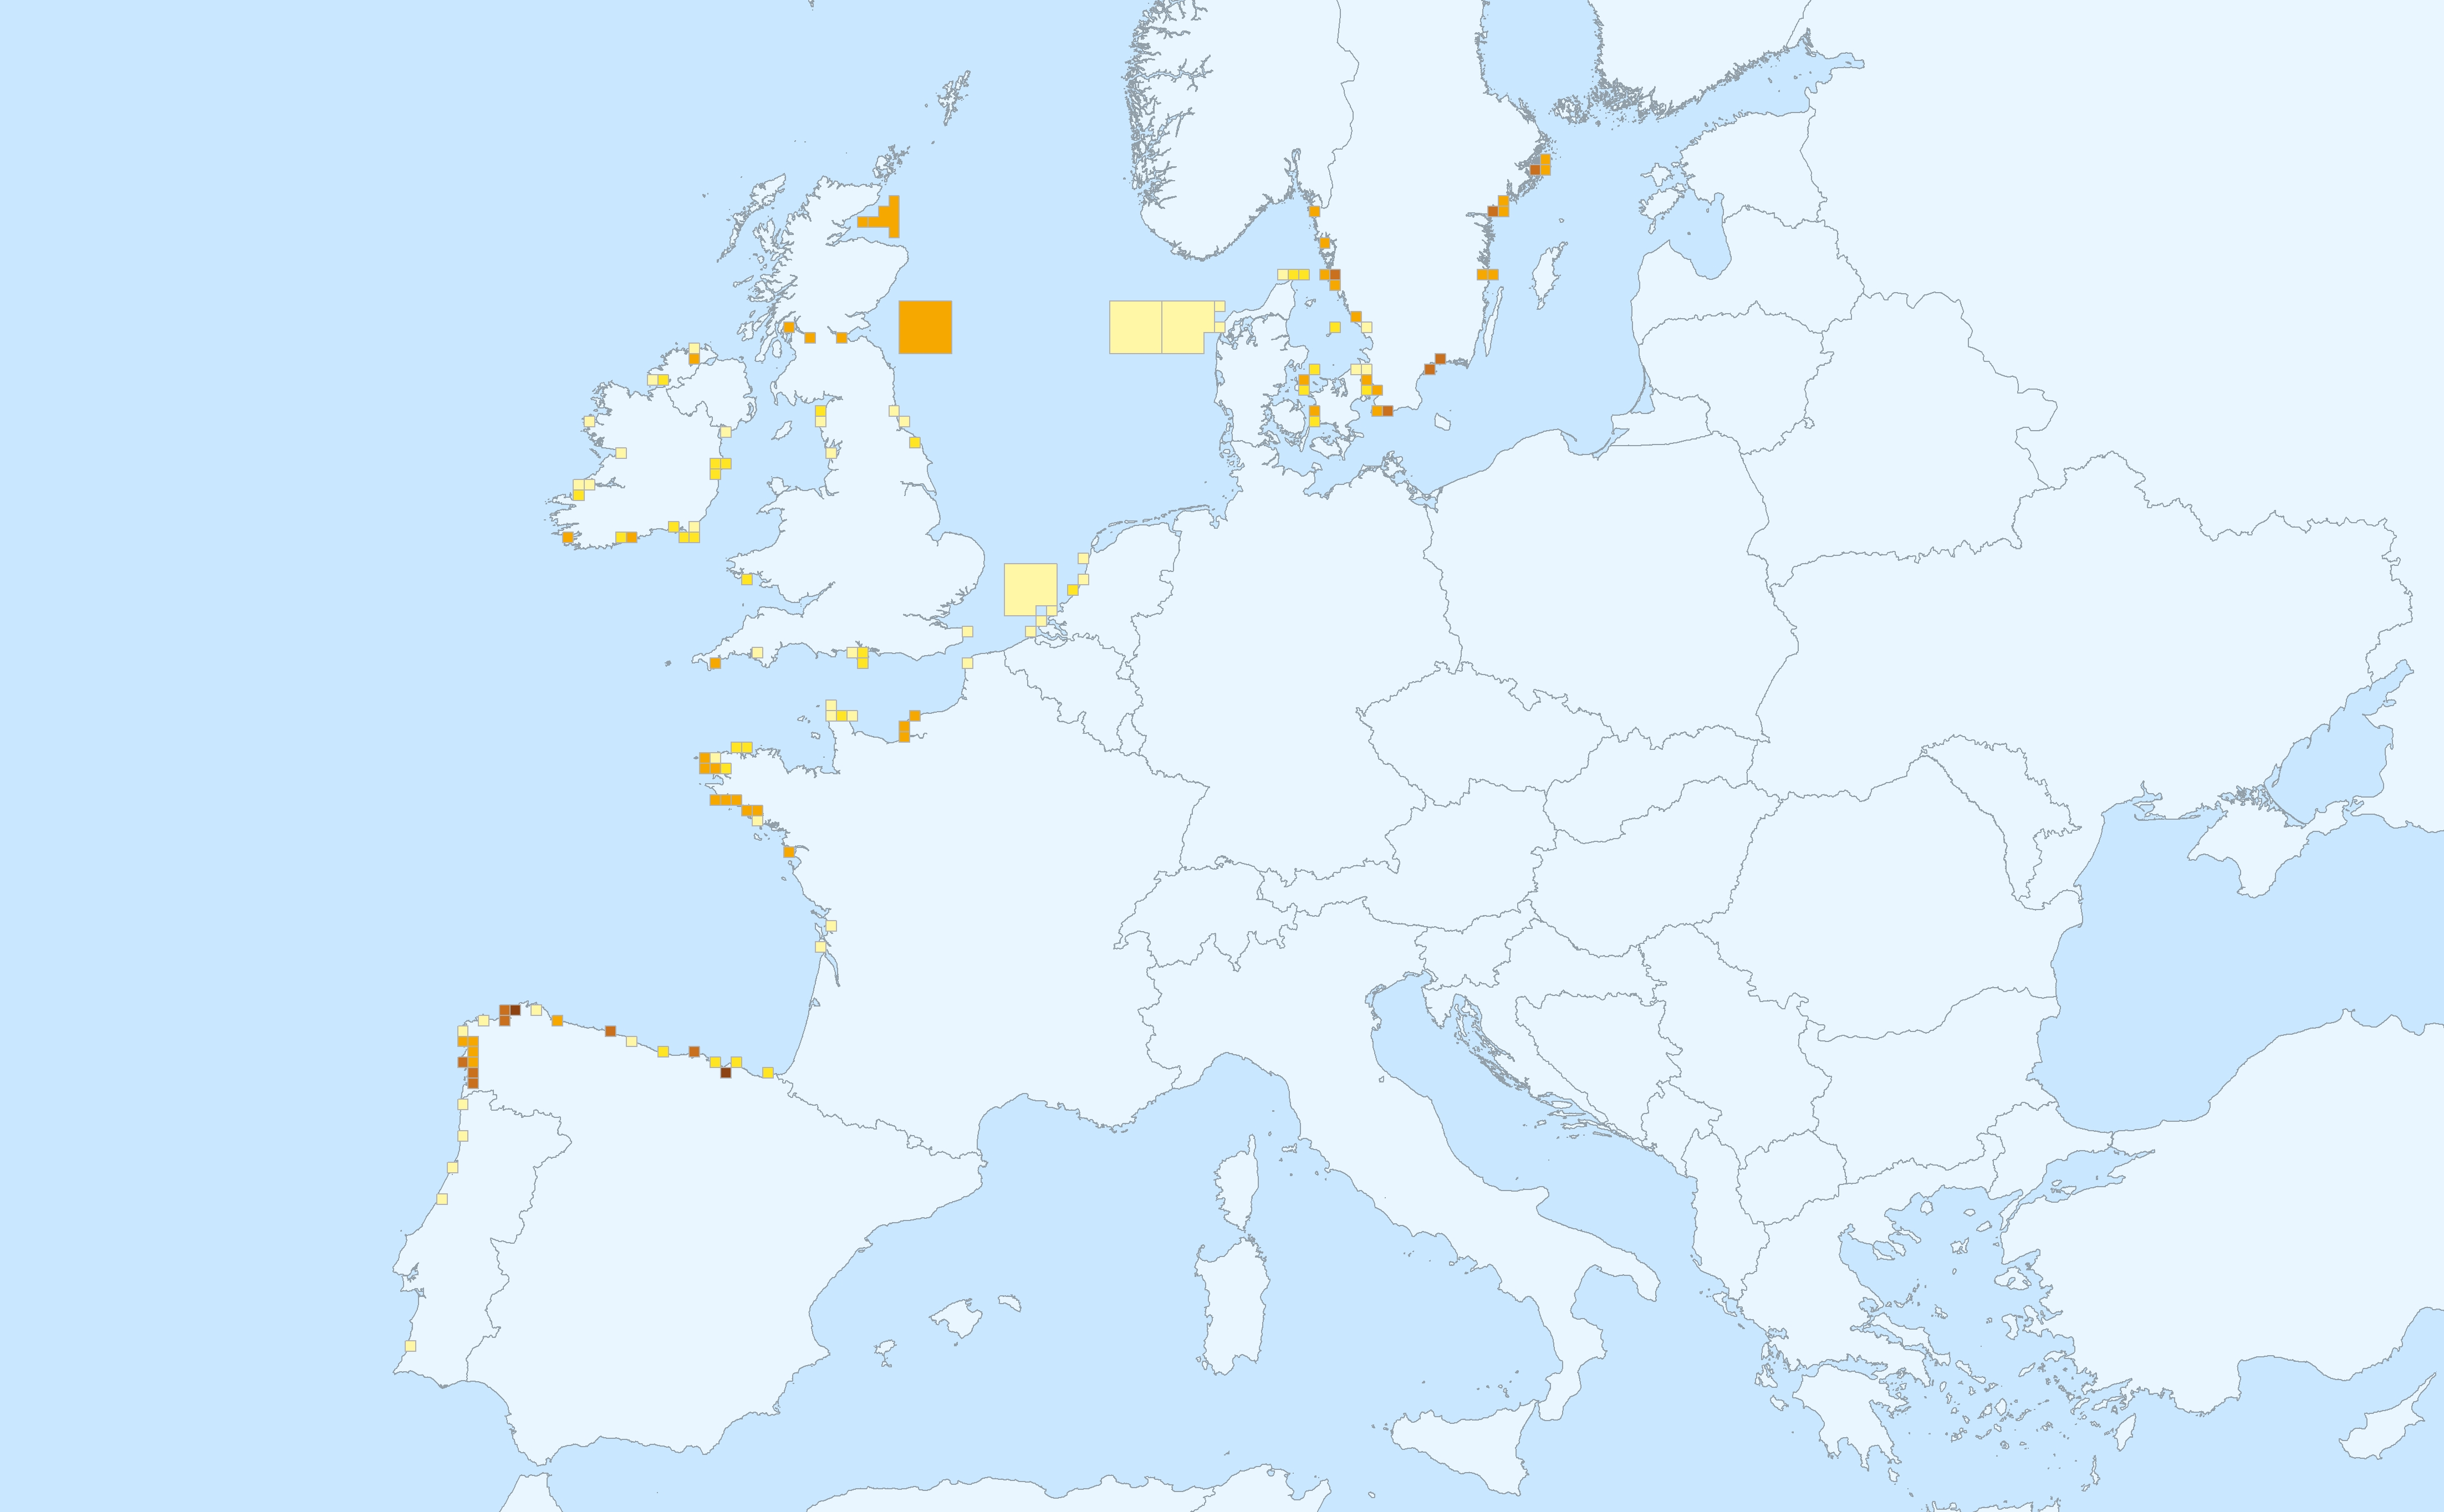
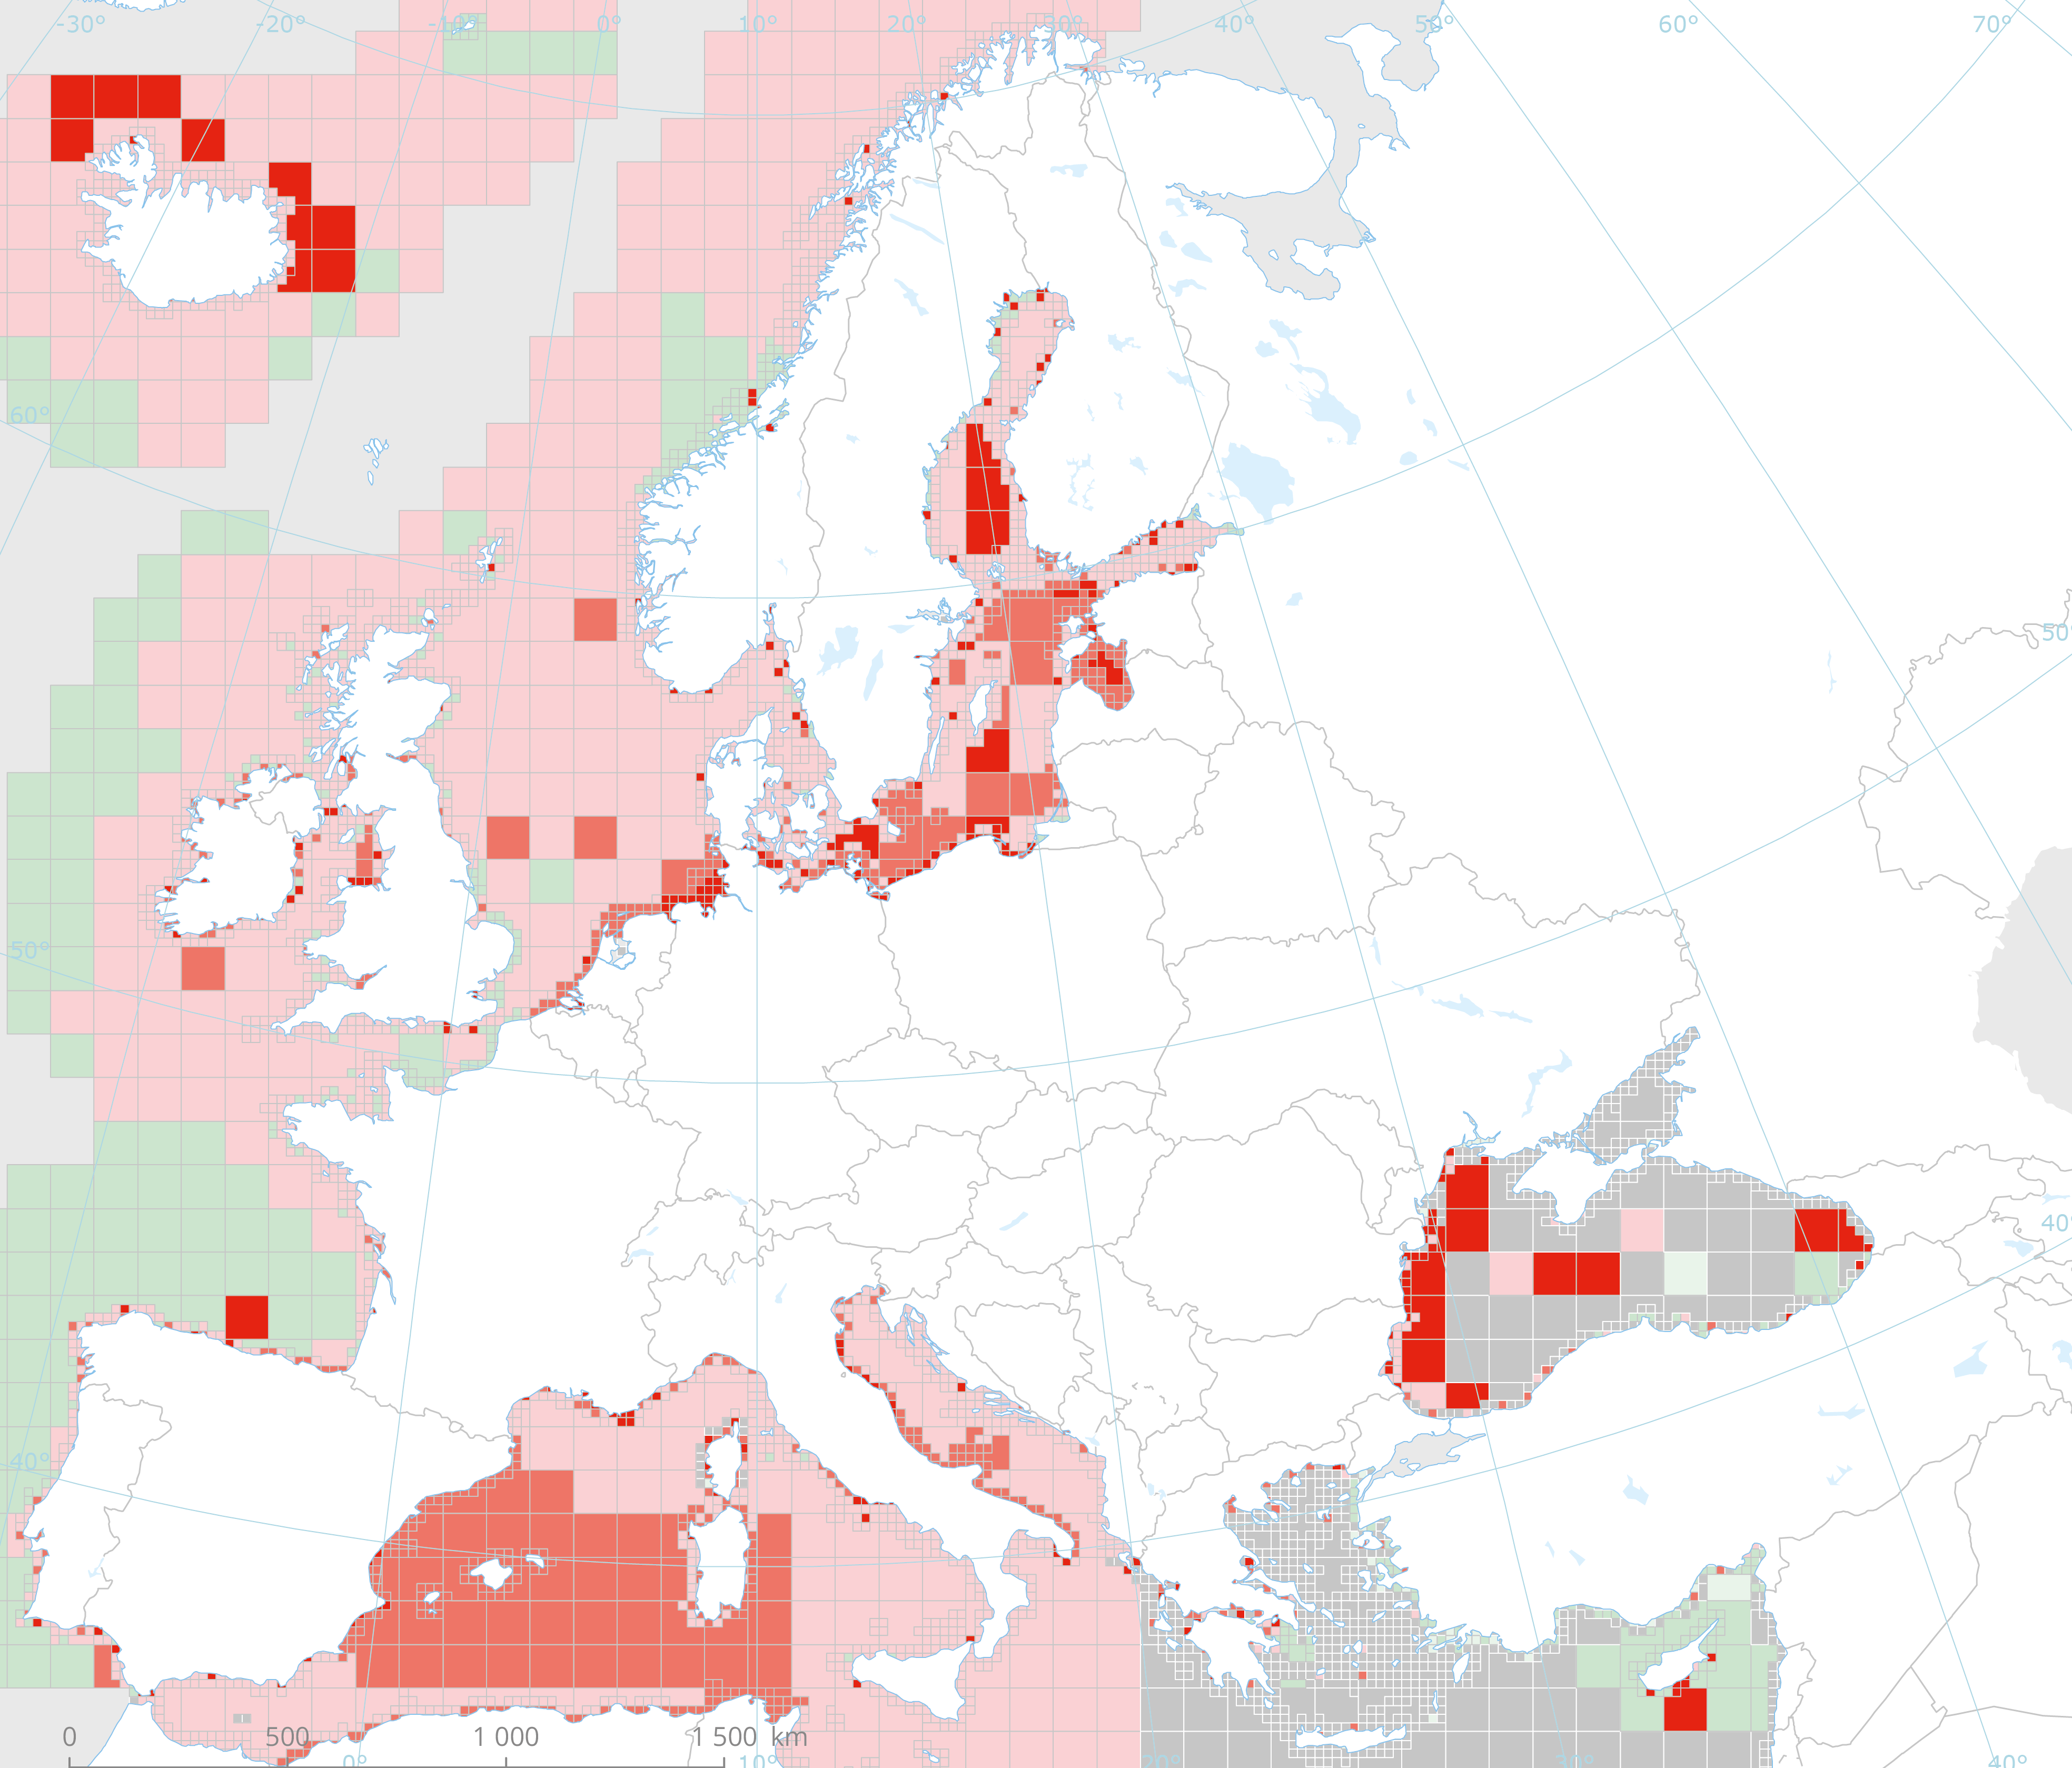
This data set presents the resulting assessment grid (based on the EEA reference grid) with the classification of chemical status of the transitional, coastal and marine waters in the context of the Water Framework Directive (WFD) and the Marine Strategy Framework Directive (MSFD), providing a mapping of contamination 'problem areas' and 'non-problem areas' based on measurements of biological effects. This classification has been performed using the CHASE+ tool, with classifications of the of contaminant status of indicators of biological effects. The status is evaluated in five classes, where NPAhigh and NPAgood are recognised as ‘non-problem areas’ and PAmoderate, PApoor and PAbad are recognised as ‘problem areas’. Monitoring biological effects is restricted to a few indicators (e.g. imposex) and data coverage is currently limited. Biological effects have thus been addressed in only 134 assessment units, mostly in the Baltic Sea, the North Sea and the North-East Atlantic Ocean. This data set underpins the findings and cartographic representations published in the EEA report “Contaminants in Europe’s seas” (No 25/2018). See the mentioned report for further information.
-
This data set presents the resulting assessment grid (based on the EEA reference grid) with the classification of chemical status of the transitional, coastal and marine waters in the context of the Water Framework Directive (WFD) and the Marine Strategy Framework Directive (MSFD), providing a mapping of contamination 'problem areas' and ‘non-problem areas’ based on measurements in the matrix "sediments". This classification has been performed using the CHASE+ tool, with classifications of the sediments matrix. The chemical status is evaluated in five classes, where NPAhigh and NPAgood are recognised as ‘non-problem areas’ and PAmoderate, PApoor and PAbad are recognised as ‘problem areas’. Most countries in Europe include marine sediments in long-term monitoring activities. Consequently, the data coverage is good, especially in southern parts of the Baltic Sea, the North Sea, the Celtic Sea, the Bay of Biscay, western parts of the Black Sea and the coastal waters of France, Italy and Portugal.The number of assessment units monitored and classified in the North-East Atlantic Ocean is 511. In the Mediterranean Sea, the number of assessment units is 153. Baltic Sea sediments are monitored on 97 assessment units while only 19 areas are assessed in the Black Sea. This data set underpins the findings and cartographic representations published in the EEA report “Contaminants in Europe’s seas” (No 25/2018). See the mentioned report for further information as well as examples of classification excluding specific groups of substances(e.g. metals, PBDEs).
-

The raster dataset represents the risk of collision of whales with vessels in Europe Seas. The most vulnerable species from ship strikes are cetaceans and turtles, since they go to the surface to breathe. On the other hand, their migration routes can overlap with shipping lanes. The collisions can produce the death or injury of the animals, and are an important threat for the conservation of these species. The dataset has been prepared in the context of the development of the first European Maritime Transport Environmental Report (EMSA-EEA report, 2021: https://www.eea.europa.eu/publications/maritime-transport).
-
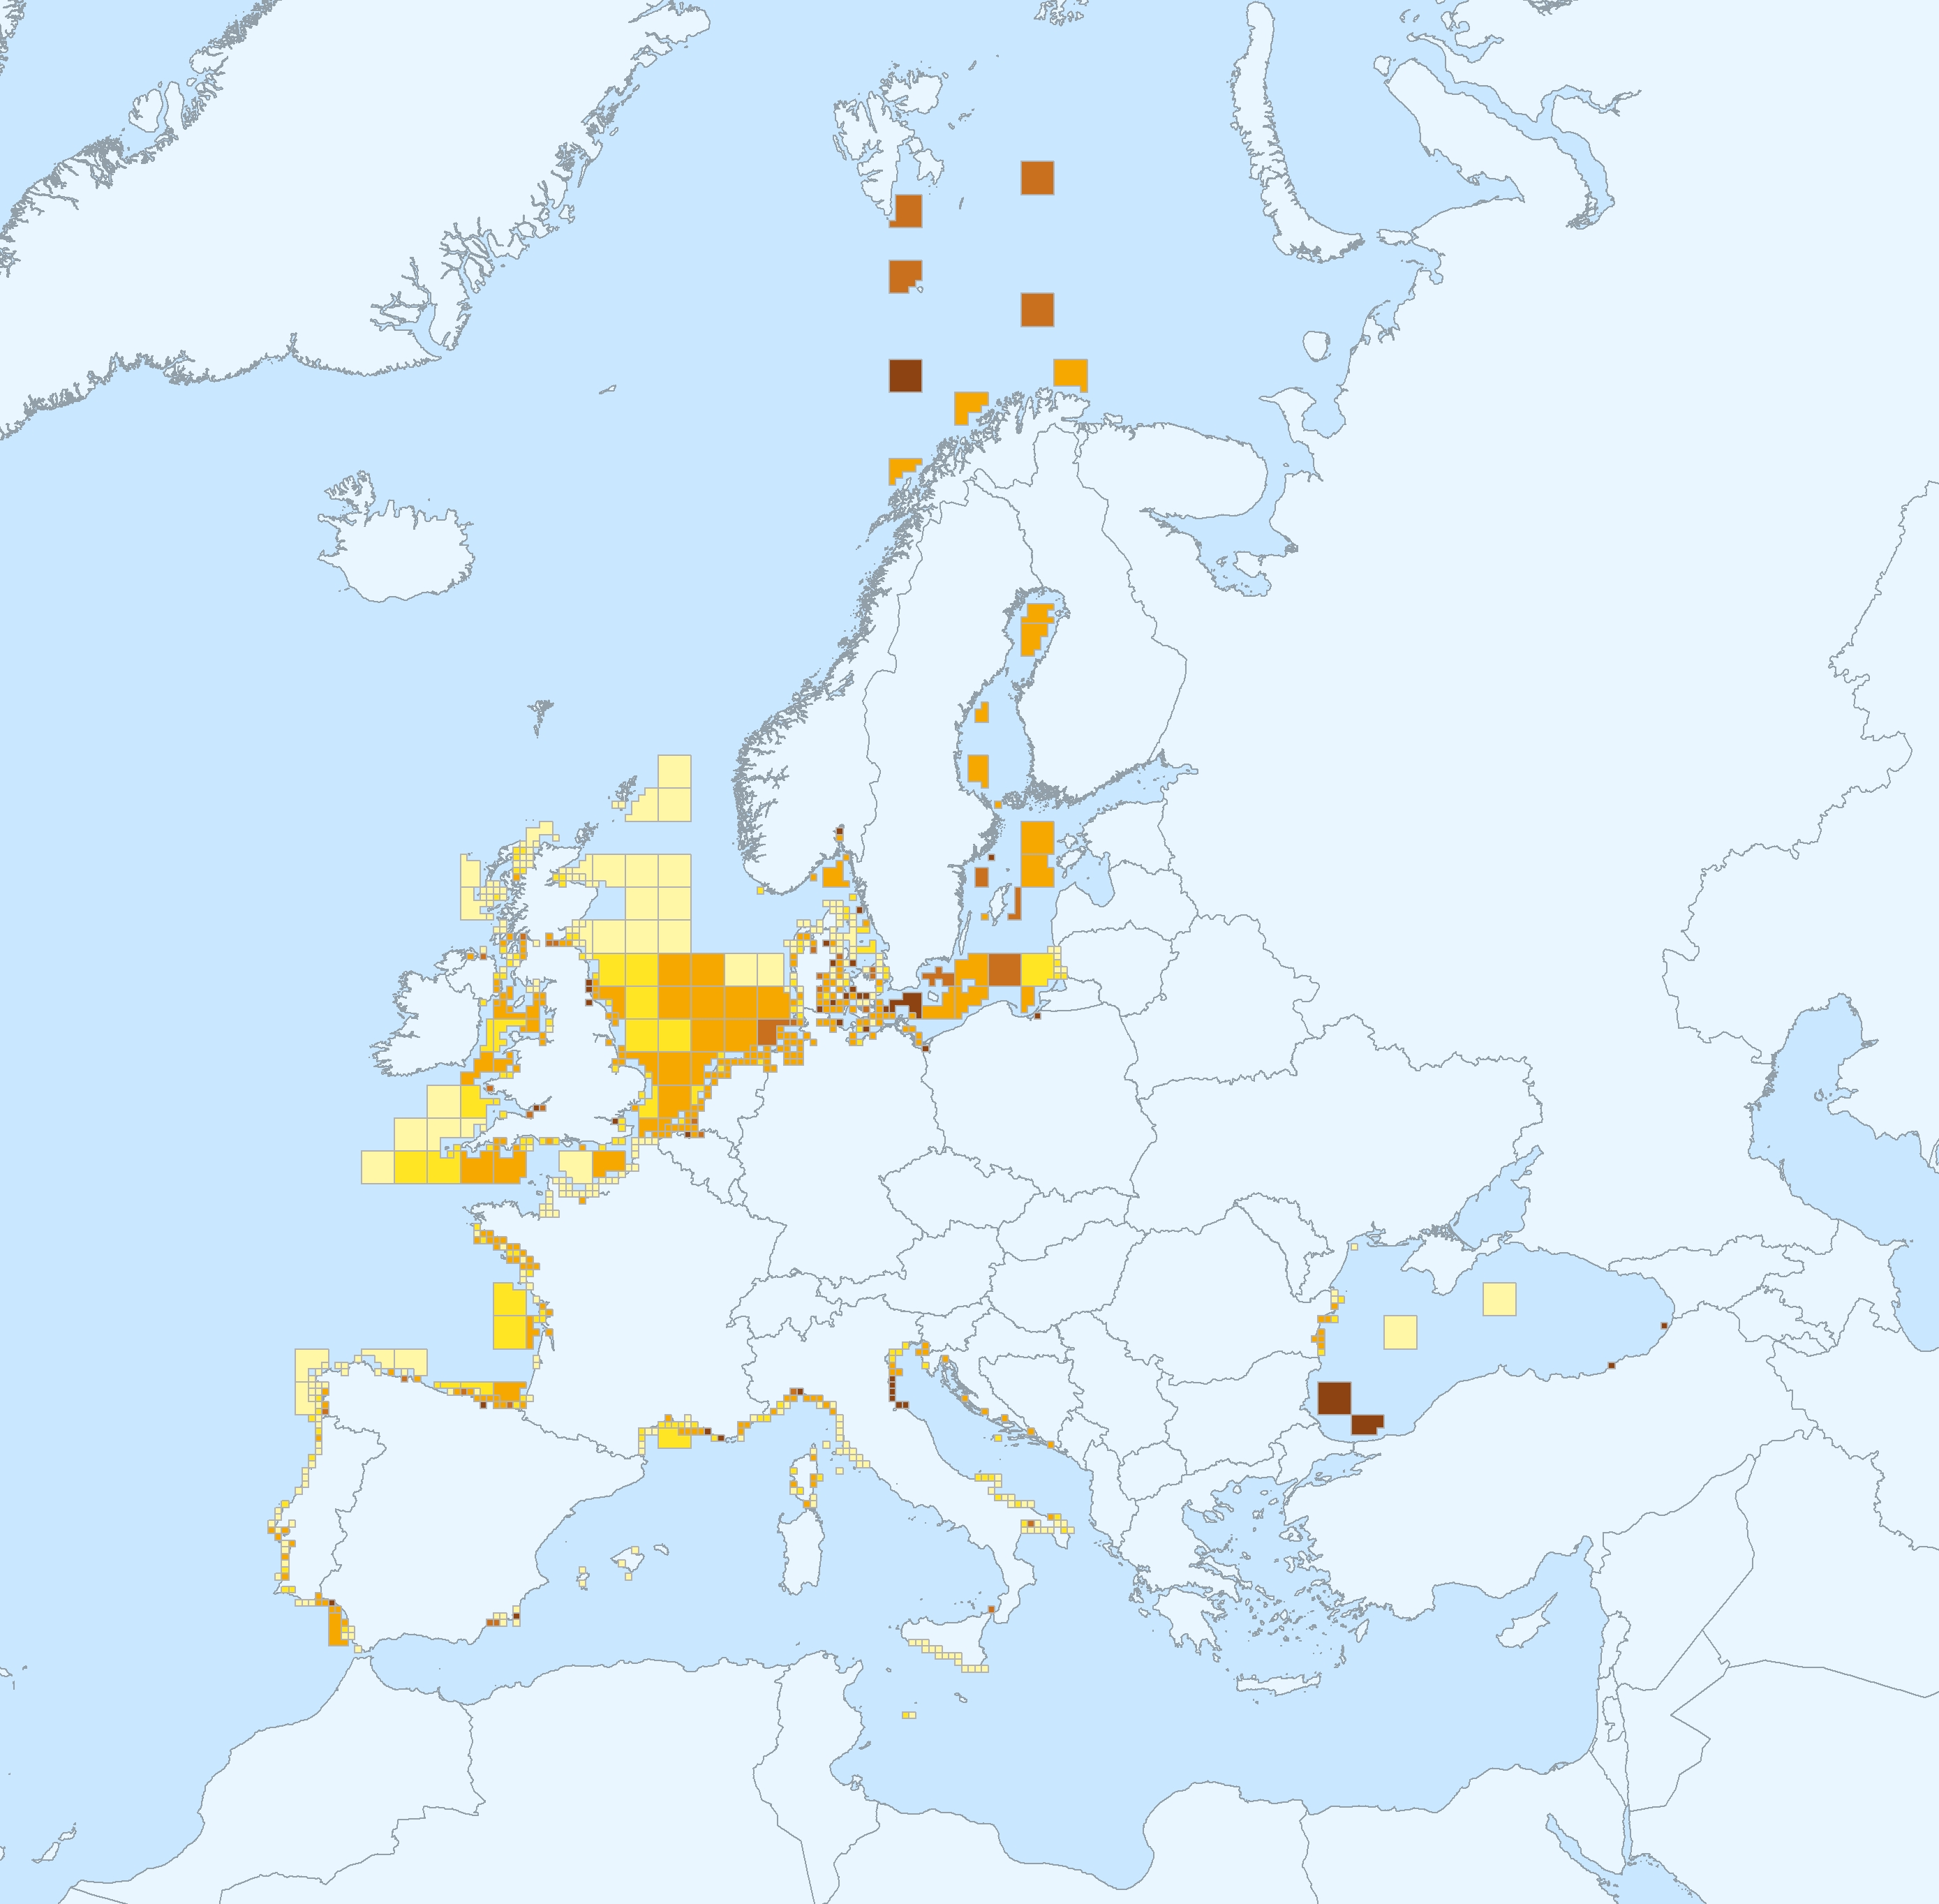
This data set presents the resulting assessment grid (based on the EEA reference grid) with the classification of chemical status of the transitional, coastal and marine waters in the context of the Water Framework Directive (WFD) and the Marine Strategy Framework Directive (MSFD), with a mapping of contamination 'problem areas' and ‘non-problem areas’ based on measurements in the matrix 'biota'. This classification has been performed using the CHASE+ tool, with classifications of the biota matrix. The chemical status is evaluated in five classes, where NPAhigh and NPAgood are recognised as ‘non-problem areas’ and PAmoderate, PApoor and PAbad are recognised as ‘problem areas’. Monitoring and assessment for the matrix 'biota' has been carried out in the North-East Atlantic Ocean (482 assessment units), Baltic sea (198 assessment units), Mediterranean Sea (161 assessment units) and Black sea (12 assessment units). This data set underpins the findings and cartographic representations published in the EEA report “Contaminants in Europe’s seas” (No 25/2018): https://www.eea.europa.eu/publications/contaminants-in-europes-seas. See the mentioned report for further information as well as examples of classification excluding specific groups of substances (e.g. metals, PBDEs).
-
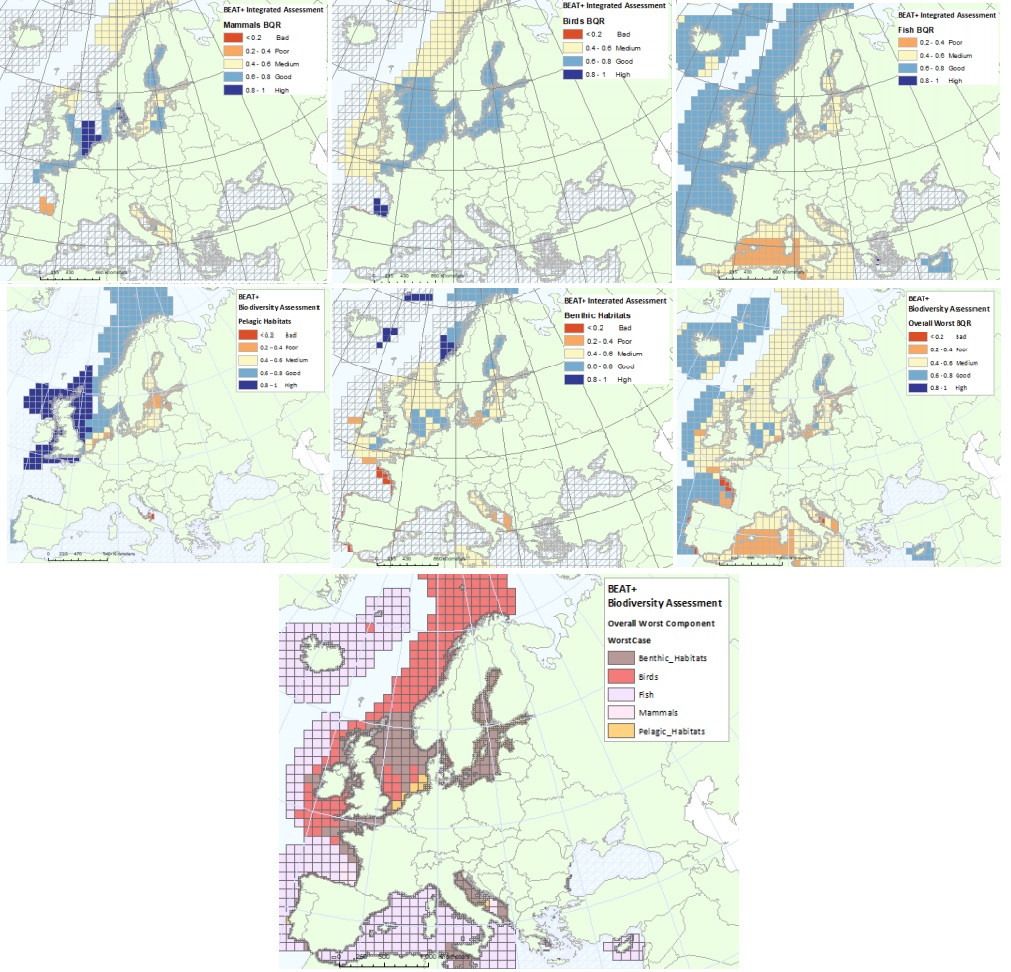
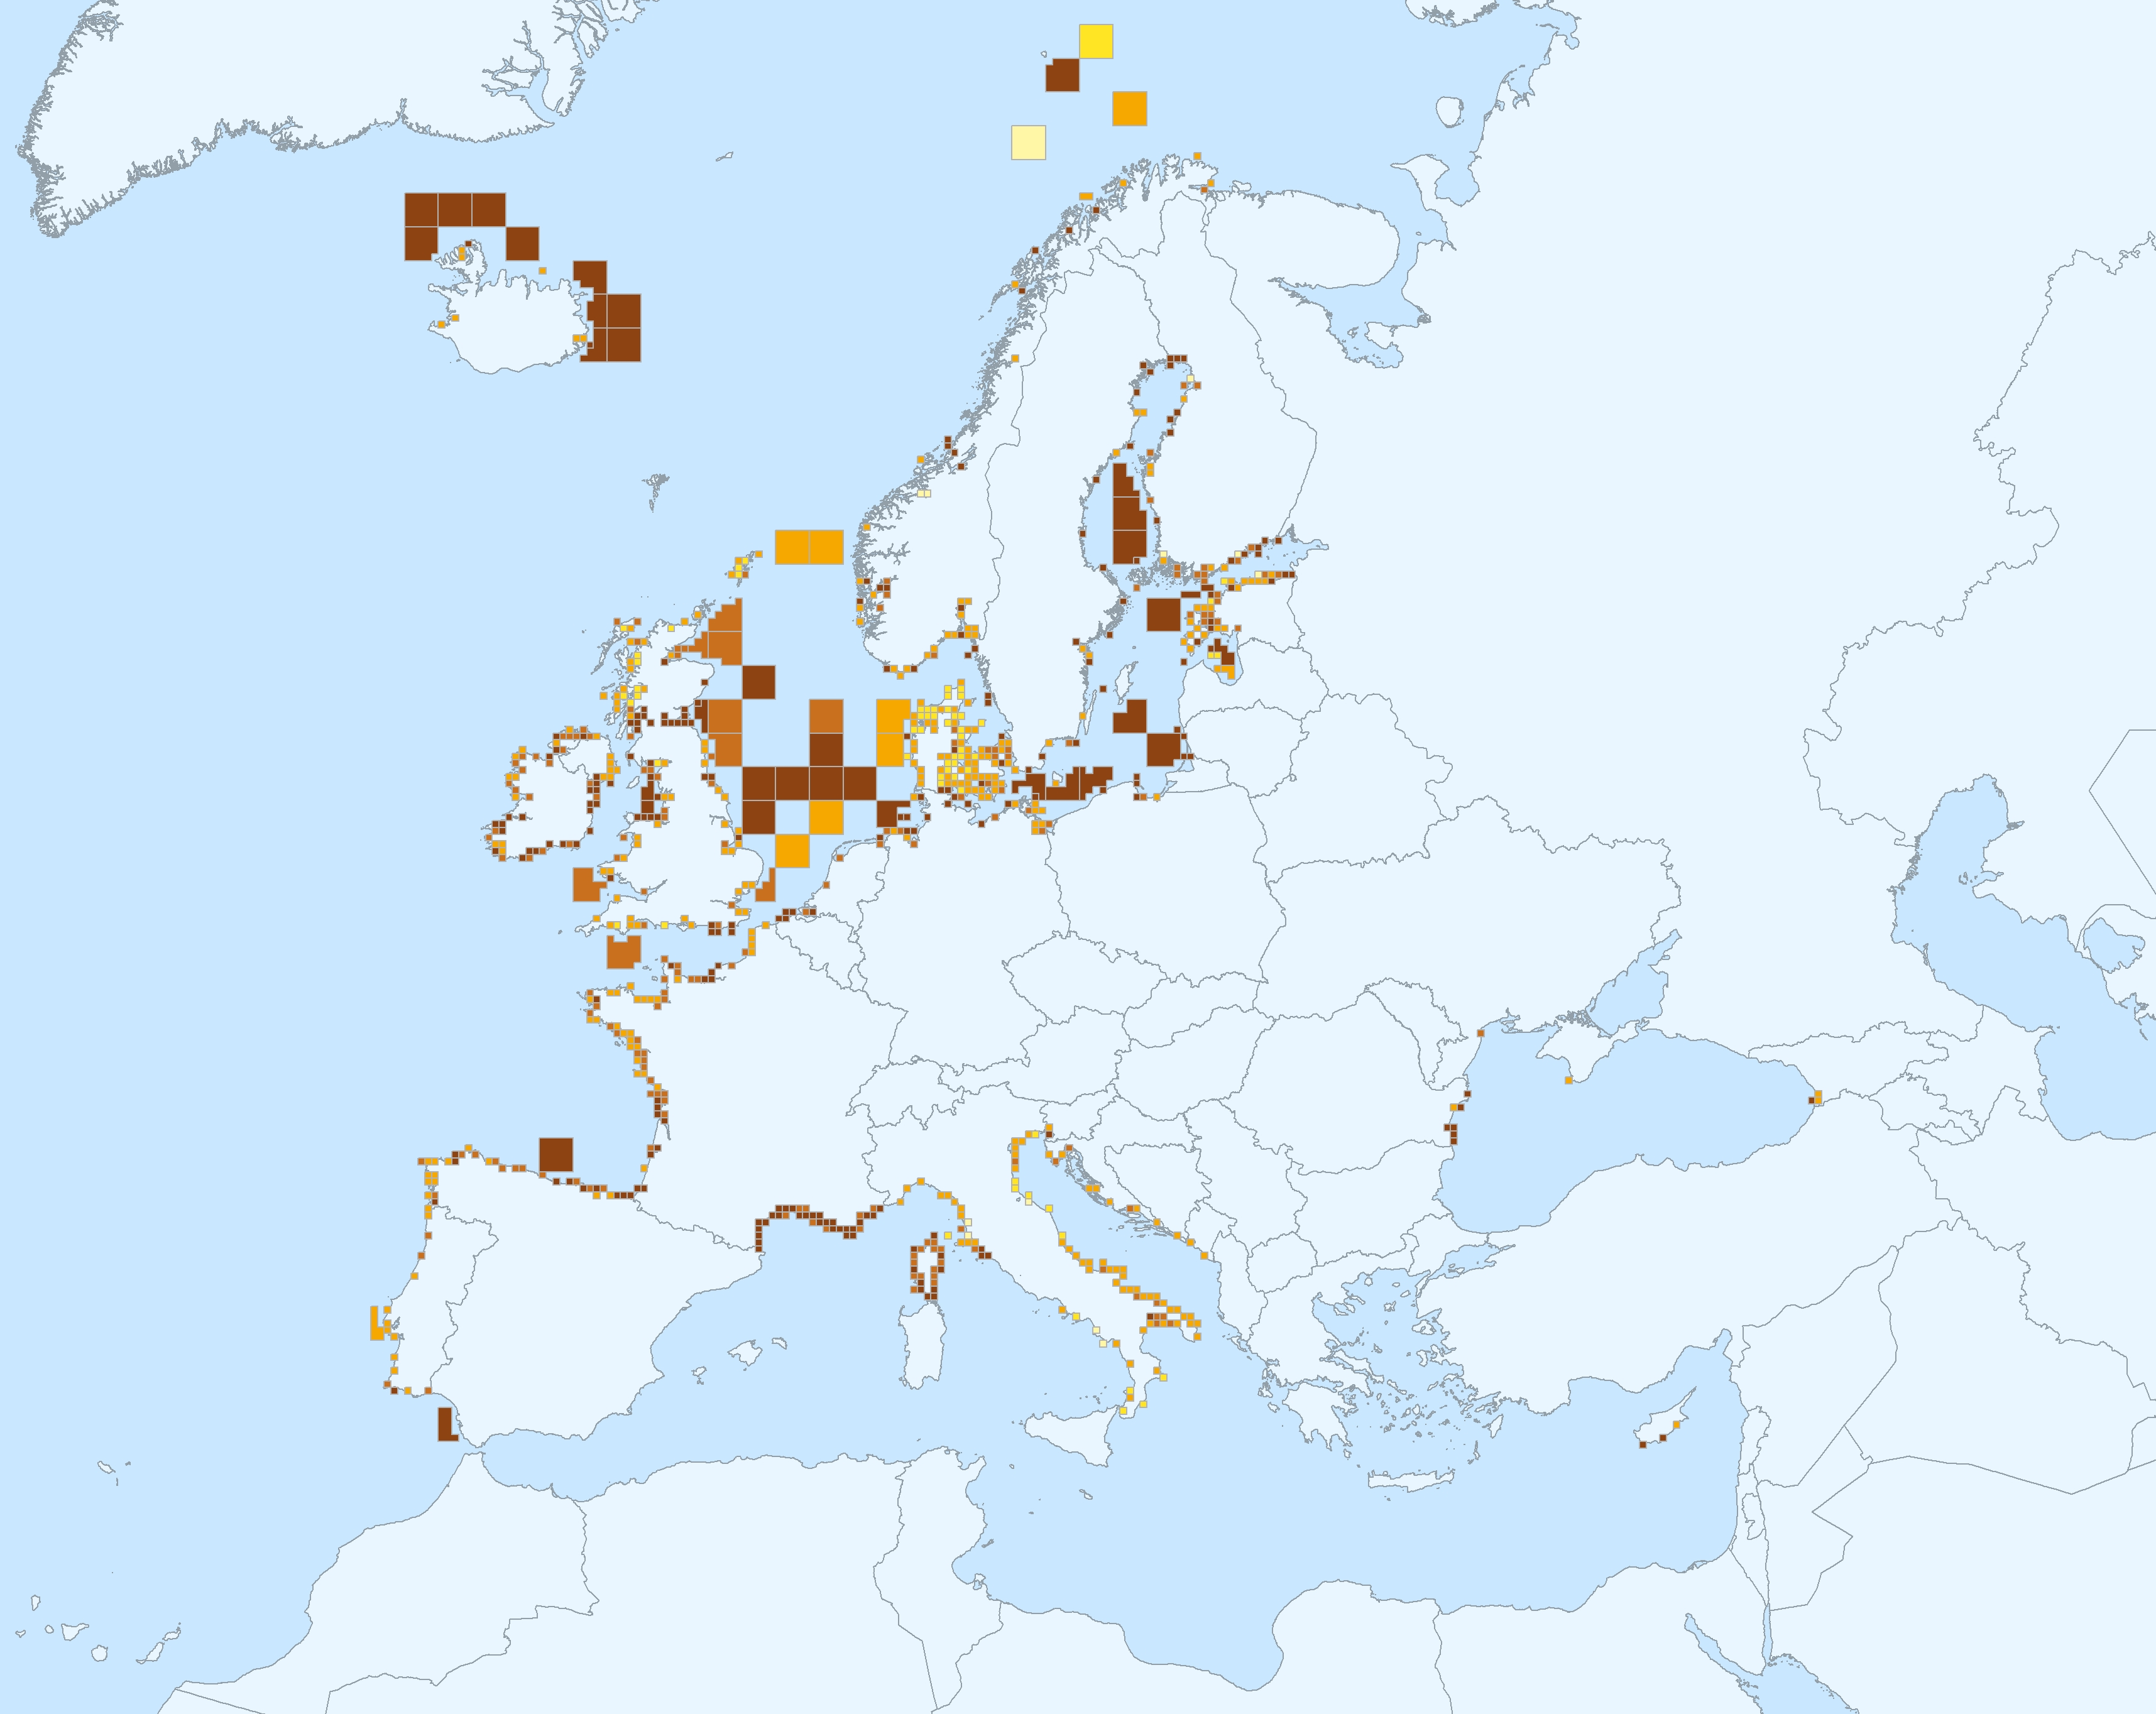
The BEAT+ tool builds on the EEA assessment tools developed and applied in the context of assessing the degree of contamination (CHASE+), eutrophication (HEAT+) and biodiversity (BEAT+) in Europe's seas. BEAT+ makes use of the same data sets and threshold values used in these assessments but recombines these in a new framework that addresses 'biodiversity condition'. BEAT+ has been designed to provide an assessment of the spatial variability of a range of biodiversity components by combining existing biodiversity indicators. The tool integrates data from normalised indicators to identify worst case status measures for different biodiversity components. The results are then linked to a standard gridE based Spatial Assessment Unit (SAU) which is used both for biodiversity and for pressures assessments (Andersen et al., 2014). These grid-based SAUs not only allow alignment of indicators for biodiversity and for pressures but provide a means for combining large assessment areas (e.g. for wide‐ranging species) with point data collected from biological surveys e.g. WFD monitoring. BEAT+ tool works by calculating a Biological Quality Ratio (BQR) which is an aggregated score of indicator outcomes within a grid square. To allow objective comparison, the indicator outcomes are normalised to a scale of 0 to 1, with five status classes at equal intervals on that scale (from Bad starting at 0, Poor at 0.2, Medium at 0.4, Good at 0.6 and High at 0.8). By this means, indicators based on different biological criteria can be aggregated in a consistent way. This metadata refers to dataset providing the results of classification of biodiversity status using the BEAT+ tool. The status is evaluated in five classes, where High and Good are recognised as ‘non-problem areas’ and Moderate, Poor and Bad are recognised as ‘problem areas’. The dataset covers: - BQR Assessment of all marine mammals combined (mainly focused on coastal and relatively stable inshore populations of seals, dolphins and porpoises) - BQR Assessment of seabirds and wading birds - BQR Assessment of commercial fish (as these have agreed targets defined on biomass and fishing mortality) - BQR Assessment of pelagic habitats - BQR Assessment of benthic habitats - BQR Assessment of worst-performing biodiversity groups - An overall synthesis of the Biological Quality Ratios (BQR) values (showing which are the worst -lowest- BQR values in each assessment grid cell. The ‘worst’ value is used here to identify the biological group most at risk, rather than averaging over all groups to avoid over-emphasis on groups with more intensive monitoring). As reference, please consult the ETC/ICM Report 3/2019: Biodiversity in Europe's seas: https://www.eionet.europa.eu/etcs/etc-icm/products/biodiversity-in-europes-seas. The indicator BEAT+ Integrated Assessment Worst Case BQR has been used in the EEA report 17/2019 "Marine Messages II": https://www.eea.europa.eu/publications/marine-messages-2.
-
This vector dataset represents the benthic broad habitat types in Europe seas potentially affected by anchoring. The anchoring of vessels can produce damages to the seafloor and the loss of the habitat where it happens. It takes place in shallow waters, close to ports, where vessels have to wait for a spot in the port so they can load or offload (since ports have a limited amount of dockage). The anchoring areas allow vessels to safely anchor in protection from bad weather or other circumstances. The type of alterations to the habitats resulting from anchoring depend mainly on the dimensions and type of the anchor, as well as its movement resulting from the movement of the vessel due to currents or waves, which can increase the adverse effects. The dataset has been prepared in the context of the development of the first European Maritime Transport Environmental Report (to be published as an EMSA-EEA report in 2021).
-
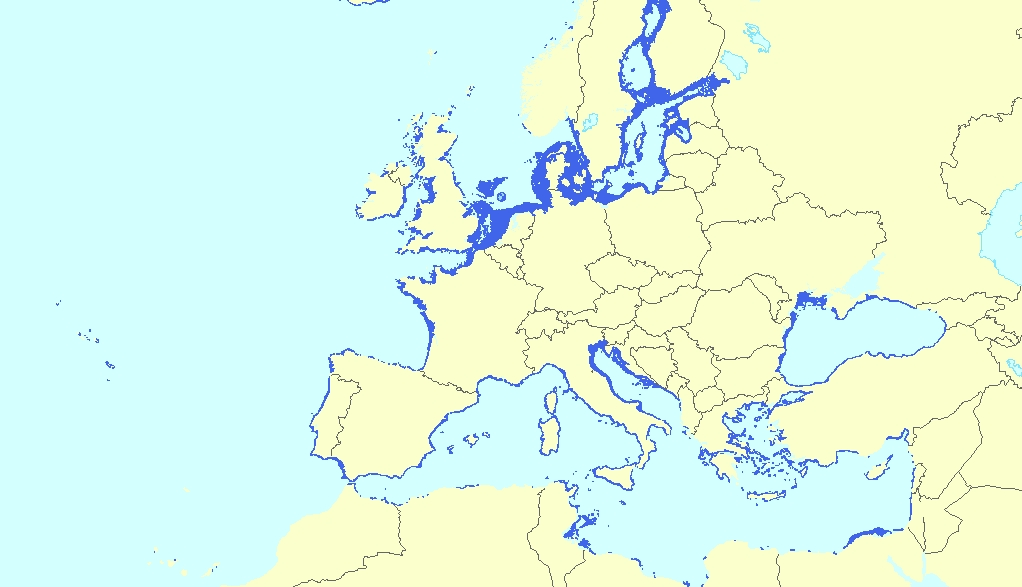
This vector dataset represents the benthic broad habitat types in Europe Seas potentially affected by the ship wakes. When navigating, the propellers of ships generate a turbulent mixing of the water that can produce sediment re-suspension in soft bottoms of shallow areas. This can increase the turbidity in those areas, affecting the seafloor organisms (especially those that are directly dependent on light, such as aquatic plants). It may also contribute to an increase of the the eutrophication level of the ecosystem (since the turbid waters may become warmer, which may turn into a reduction of dissolved oxygen in water). Finally, turbidity can produce an increase in the inputs of contaminants and microbial pathogens, since those can become attached to the suspended solids. The dataset has been prepared in the context of the development of the first European Maritime Transport Environmental Report (https://www.eea.europa.eu/publications/maritime-transport).